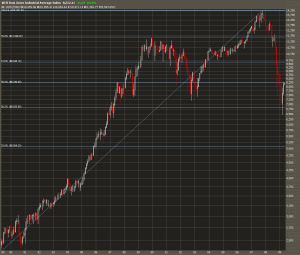
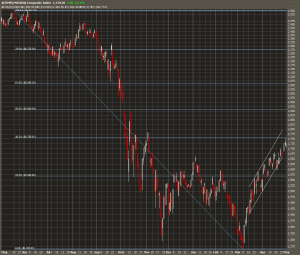
Futures rally on better than expected Q3 GDP (3.5% vs. 3.2% median estimate). Is this enough to stop the current retracement? There will be an early morning pop, and the markets won’t take long to reveal which way they are headed. If the early morning gains are not sustained, SPX will retest 1000. Yesterday, NASDAQ closed below 50 day moving average on 120% of 10 day average volume.
Tag Archives: spx
Welcome Back!
I apologize to those consistently checking for new posts, and I thank you for your dedication. As the school year came to an end, I didn’t feel comfortable posting without giving my undivided attention to the current events in the market. The markets are dynamic and require constant interpretation.
Having said this, I’d like to reiterate my positions and price targets. I am still bullish on the financial sector, as well as the overall market. I can see both the DJIA and the SPX testing 10,000 and 1000 respectively before any significant resistance and/or retracement. During last week’s move higher, the trading volume spiked above the 10 day average, about 5B. This week is setting up for a huge move, many will suggest lower, but I believe we could see the mother of all short squeezes. As of the end of March, there was approximately $3.9 trillion in money-market fund assets and about $3.4 trillion in equity mutual fund assets. This unusual proportion implies that the current rally could pick up steam, and fast. From August 2008 to March 2009, there has only been one month where equity assets have increased, December. Although February to March did increase, April’s numbers will be more telling. Money-Market assets have consistently increased from September 2008 to January 2009, remaining essentially constant from January to March. May of 2008 boasted excess of $6 trillion in equity assets suggesting the current position could almost double. The price impact of this large of a monetary influx would be tremendous. Yesterday’s decline was short lived, and it should be noted that tech did not decline as much as the rest of the market.
After the market closes I will continue the post.
Building a New Foundation

SPX
The SPX has broken out above the 877 Fibonacci retracement level. This is extremely bullish, and from a technical standpoint suggests the SPX is headed to 934. Closing above 877 is important and will confirm the suspected rally. I expect to see the DJIA test 9000 and the SPX to test 950 over the next couple of weeks. If the markets create support at the current levels, enough consolidation will have occurred to support a substantial rally in the near future. The talking heads on CNBC are finally catching on and have suggested the possibility of DOW 10k by the end of the summer. Please review my archived newsletter http://marketfallacy.com/newsletter/files/Market_Fallacy_%7C_4-7-09_%7C_Cautiously_Optimistic_2009-04-07.html, to see that I have been suggesting this possibility since April 7th, when the DJIA closed at 7790.
Here is one of the articles on CNBC’s website suggesting DOW 10k. http://www.cnbc.com/id/30478135 However, my reference is to the anchors on CNBC’s television show.
Sell in May and Go Away?
The major indices declined Monday and Tuesday on fears that the Swine Flu would turn into world-wide pandemic. As of Wednesday night, there have been 93 confirmed cases in the United States and one death. The one death in the United States was a 22 month baby in Texas, but the baby was not an American citizen. The baby was a Mexican citizen and was visiting Texas to receive medical attention. Although it is suspected that as many as 160 people have died in Mexico only 8 deaths have been confirmed. Swine Flu is suspected of sickening more than 2,500 people in Mexico, but only 99 cases have been confirmed by the CDC[2]. While this could escalate into a world-wide pandemic if the virus is able to spread to enough people, it is likely to be less serious than the attention it is receiving. Only people from Mexico have died, a fact that scientists cannot explain thus far. It is likely that Swine Flu will pass faster than Bird Flu or SARS[3]. Some of the confirmed cases in the United States did not know they had the virus, which may suggest the virus can be controlled with proper precautions.
Last Thursday, jobless claims[4] decreased by less than expected, implying an economic recovery. Although the existing home sales[5] were worse than expected, new home sales[6] exceeded expectations. This mixed housing data supports the notion that the housing market is bottoming. On Tuesday, consumer confidence posted[7] the largest one-month jump in four years. This data sparked an early morning rally, but low volume and Swine Flu concerns caused a late afternoon fade. GDP[8] contracted more than expected for the first quarter of 2009. This news, along with the Federal Reserve meeting, acted as the catalyst for Wednesday’s 2%+ rally.
The results of the Stress Test will be announced Monday, May 4th. There have been many rumors surrounding the release of these results, specifically in regards to some of the banks needing additional capital. Citigroup will likely announce the conversion of preferred shares for common shares at the conversion price of $3.25 on Monday following the release of the Stress Test results. The conversion will be an attempt to improve their tangible common equity, one of the main metrics of the Stress Test.
Market Fallacy expects the major indices to trade significantly higher over the next seven trading days. Current targets[9] for the SPX and DJIA are 950 and 9000 respectively. Following this explosion to the upside, an ensuing retracement is highly probable. The major indices have established new support above the previous resistant levels, an extremely bullish sign. The markets are preparing for a significant move in either direction, with a slightly higher probability for a move higher. It is not impossible for a retracement over the next two weeks, but unlikely. Market Fallacy now has a blog, which will attempt to provide insight into individual questions concerning the markets. Please visit the blog to receive personal attention regarding the markets. http://www.marketfallacy.wordpress.com
[1] SPX, synonymous with S&P 500, closed down 0.39% for the week beginning April 20
[2] Center for Disease Control and Prevention
[3] Severe acute Respiratory Syndrome
[4] Jobless claims consensus 651,000 vs. 646,750 actual
[5] Existing home sales consensus 4.72 million vs. 4.57 million actual
[6] New home sales consensus 330,000 vs. 356,000 actual
[7] Consumer confidence consensus 30.0 vs. 39.2 actual
[8] GDP consensus -5.0% vs. -6.1% actual
[9] S&P 500 target 950 and Dow Jones Industrial Average target 9000
Posted in Market Fallacy Newsletter Archives
Tagged citigroup, spx, stress test, technical analysis
7 Weeks?
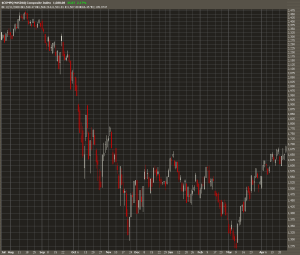
Nasdaq Composite

Apple (AAPL)
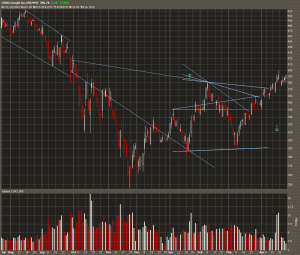
Google (GOOG)

Research in Motion (RIMM)
Russell 2000
Citigroup (C)
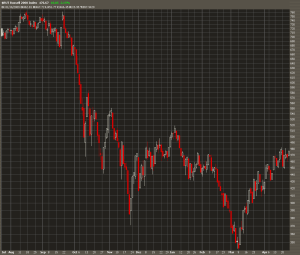
The markets are closing in on the gap between last Friday’s close and the 7th week of consecutive up weeks. Actually, some of the indices have already filled this gap. The Nasdaq Composite, representing smaller and technology based companies, which is positive year-to-date, has already filled the gap. In the charts above, the Nasdaq Composite, Apple, Google and Research in Motion are all currently establishing a new floor or support levels. Similar action is occurring in the Russell 2000. Both the Nasdaq and the Russell 2000 indices have consistently led the rally. Put another way, the Nasdaq and Russell 2000 have foreshadowed both the rallies and the declines for the last couple of months. It is for this purpose, that I reference them and point out the consolidation activity.
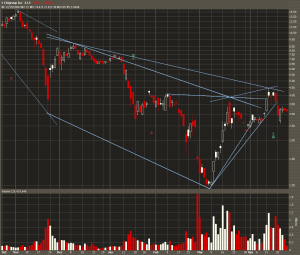
I also want to address Citigroup’s behavior. Citigroup is the only large bank that is not taking part in the current rally. Large banks here refer to Citigroup, Goldman Sachs, Bank of America, JP Morgan Chase, Wells Fargo and Morgan Stanley. The days following Citigroup’s earnings announcement, have seen the stock drop by approximately 20%. Citigroup has declined the last couple of days on lower than normal volume. However, yesterday’s candle on Citigroup was a hammer, a bullish sign. If Citigroup closes above $3.30, today’s candle will be a bullish engulfing candle. This would confirm yesterday’s bullish suggestion.
The importance of volume cannot be stressed enough. The higher the volume, the more valid the market movement. If the SPX closes above 870, extending the consecutive week streak, and does so on high volume, this will confirm my expectation the markets are setting up for the next move higher. The 10-day average volume for the SPX is about 6.1B shares. Currently the SPX has traded about 3.5B shares halfway through the trading day.
Posted in Stock Market
Tagged aapl, apple, bullish candlesticks, c, citigroup, goog, google, nasdaq, research in motion, rimm, russell 2000, spx, volume
Support and Resistance Levels for the SPX

SPX
Yesterday’s decline was very misleading to a lot people. The market dropped hard and every sector felt the fallout. Because no sector was left unscathed, the effects were magnified. This distortion caused some people to load up on short positions in certain sectors, particularly the financials. However, today’s rally was led by the same financials. Right now the financial sector is the strongest and most influenced by manipulation (term many bears use to describe the government regulation). Please do not fight this trend, the government has made it clear they will do everything in their power, including implementing legislation to benefit the banks. The name of the game is the banks win. On April 24, banks may receive preliminary results from the stress tests and the Federal Reserve is expected to release the methodology for the assessment. Final results are expected May 4.
Today the Treasury Secretary, Timothy Geithner, implied that the stress test results will indicate that most of the 19 biggest U.S. banks will have enough capital. The banks that require further funds are expected to get a mix of converted government preference shares and private money. It is no coincidence that the following this announcement the markets rallied, and were led by the financials. The three largest banks (Citigroup, JP Morgan Chase, Bank of America), by market capitalization, receiving bailout money all advanced at least 9%.
From a technical standpoint, if the SPX can close above the 877 resistance level, the next technical target is 1,008. Closing above 880 and forming a base will be bullish as it will create a new floor about 50 points higher than the previous (830 range). If the markets can consolidate around this level without any significant retracement or without retesting previous levels, we will see SPX 1000 in the near future. Near future here does not mean next week or even next month, but rather implies the SPX will see 1000 before it sees 800. The SPX is still trading within the uptrending channel, and with each passing day, the top of the channel is increasing.

Citigroup (C)
In a shorter time frame Citigroup is making a bullish flag pattern. According to the technicals, no breakout to confirm this pattern has occurred. In this chart, today’s candle was almost a bullish engulfing candle pattern. I understand that “almost” is worthless, but the price action reveals bullish momentum. Citigroup also bounced off of its 50 day moving average this morning, which is also bullish. If Citigroup closes above the $4.00 resistance level for consecutive days, a breakout to $5.00 would be immanent. I can see Citi reaching the upside resistance of $7.00 around the time the SPX is approaching 1000. I continue to see huge upside potential in the financial sector. I expect today’s trend of the financials leading the market higher. It should be noted that this is not as bad as some (Art Cashin) make it out to be. For many experienced traders, the consensus is that the sector that led into the recession will not lead out. While I will agree with this statement, it is important not to lose sight of the fact that the financial crisis was a direct result of the housing bubble bursting. The financials are perceived as the sector that led the markets lower, but this is only because they are larger and received more media coverage. The financials can and will lead us out of this economic downturn. They will not be the only sector as I expect tech and small caps to excel as well.
Posted in Technical
Tagged art cashin, bac, bank of america, bullish, c, citigroup, federal reserve, jp morgan chase, jpm, resistance, spx, stress test, support, technical analysis, timothy geithner, treasury secretary
1000 Point Rally Coming
SPX

CBOE Volatility Index
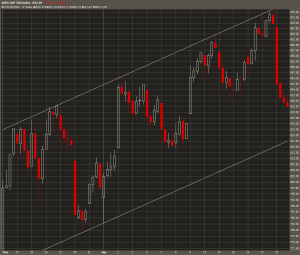
Even though the DJIA has rallied just over 1400 points off of the March lows, the markets are setting up for another 1000 point run. The rally off the bottom was just under 22% in 30 trading days. Bears that are building short positions, are doing so under the false assumptions 1) the market is overbought 2) it cannot go any higher. These two delusions couldn’t be further from reality. Markets are never overbought or oversold. Maybe relatively overbought or oversold, but you show me a time period we are overbought, and I’ll show you a different time frame where we are oversold. For example, many bears argue the markets are severely overbought. I might agree that they are relatively overbought, but in the last year, they are most definitely still oversold. Saying the markets cannot go any higher is the same mistake many people made on the way down from 14,000. At 10,000 I heard many people saying, no way we can go any lower. Wrong. This time is no different.
The SPX chart above illustrates the markets are in the middle of the channel, and currently neither too “overbought” or “oversold.” This chart illustrates why the markets are headed much higher: higher lows and higher highs. The pattern of higher lows and higher highs is extremely bullish. In keeping with this pattern, the next time the SPX touches the top of the channel, it will happen above 875, I expect this to happen around 900.
The CBOE Volatility Index chart above supports the uptrend. The CBOE Volatility Index is commonly referred to as the fear index as it reflects the implied volatility of the S&P 500 index options. The down trending channel suggests fear and uncertainty are leaving the markets. It should also be noted that the index typically trades within a channel, usually a horizontal channel. The fact that the index did not breach 40 today is extremely bullish. Previously 40 had been support. Now 40 is resistance. The translates into further extensions of this rally. Today’s market movement was healthy and very indicative of bull markets. Bull markets see many smaller up days and few larger down days. Until early March, the scenario was reversed. Before March, up days were large and there were many more down days. The Fibonacci retracements show 33.22 as the next support level. On Friday, the index traded very close to this without closing below it. Based on the retracement pattern, if the index closes below 33.22, it will trade towards 17. If the index touches 17, I will guarantee the DJIA is at least 1000 points higher.
Lastly, for those who do not believe in technicals, I can show fundamental support of this prediction. Dating back to 1959, the 7 recessions that have occurred have lasted on average just over 1 year. The current recession is in its 17th month. Of the 7 recessions that have occurred since 1959, only 5 are technically recessions. Economists will generally agree that recessions are defined by two consecutive quarters of negative growth. Only 1 of the last 7 recessions had three consecutive quarters of negative growth. The current recession has had two. The economic data is showing empirical support that the economy is improving, or at the very least, that housing has bottomed. Considering the level of government spending coupled with quantitative easing and the significantly increasing money supply, once growth begins, it will explode. Although most of this growth can be attributed to inflation, it is growth nonetheless. Once the all clear signal is given, the unprecedented level of cash on the sidelines will pour into the equity markets causing a huge rally.
This is extremely bullish
SPX
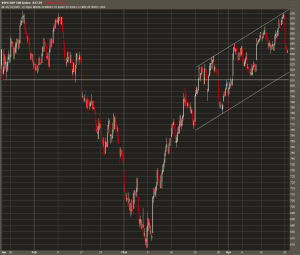
The uptrend is not over! The markets are adjusting perfectly for the next move higher. In the chart, the SPX is trading in an upward trending channel. The downside resistance in the channel is SPX 820 in a worse case scenario today. It is very likely we will close much above this as closing at 820 would be almost a 6% slide. The horizontal line on this chart illustrates former resistance becoming support. If the SPX retests 820, it will make a double bottom. Not on this chart, Fibonacci retracement levels for 3 month time frame are: 875 and the March lows of 667. It’s no coincidence the SPX retraced after touching 875, this is very healthy. If Fibonacci retracement lines are drawn on this chart, in this time frame, the next support level is at SPX 832. As a result, I am not surprised that currently we are trading at 836. I do not expect the day to get much worse. In the recent uptrend, down days have been violent and on low volume, and today is no different. There has not been more than two consecutive down days since the March lows. Although it is possible for us to be down again tomorrow, I do not expect this, unless there is a negative earnings surprise.
Unfortunately, people forget quickly and have unreasonable expectations. Many bears are coming out of the woodwork, saying “I told you the markets were due.” They proceed to suggest that now the bulls are “bottom fishing.” I find this very ironic since most of the bears have been top fishing for the last six weeks. This time, the bears who went short on Friday, got lucky. There is no real catalyst for today’s downward price pressure other than the fact that markets do not move in a straight line. It is terribly wrong to try to short this rally. Eight months ago I traded by the saying “don’t be caught wrong long.” All this simply means is that if I’m going to be wrong, I might as well be wrong short. Since I was fairly certain the economy was getting worse, this was a safer bet. Now the economy is improving, and the saying has switched. Being wrong short is a recipe for disaster. It’s clear the government will do whatever it has to for the banks to succeed. Do not try to get cute and attempt to time this perfectly. If you are uncomfortable with today’s down move, close your long positions, but do not try to short this. I will almost guarantee, all else equal, the market closes on Friday higher than it closes today.
Posted in Technical
Tagged bullish, bulls, expectations, fibonacci retracements, s&p 500, spx

