Markets betting on Brown

U.S. Financial Markets rallied Tuesday on speculation that Republican Scott Brown would win the late Senator Ted Kennedy’s vacant seat. A Brown win could cause potential problems for Democrats and those in favor of President Obama’s health care plan. As a result, the health care index ($HCX) closed up 2.04% while the hospital index ($RXH) closed up only 0.61%. The hospital index opened lower, but traded higher throughout the day as the rest of the market rallied.

The markets began pricing the Republican win early in the trading session. The U.S. Dollar and equity markets rallied on the speculation that a Republican win in Massachusetts would help to bring Washington closer to normalcy. However, Brown’s victory may have some serious economic implications that many have not considered. Scott Brown’s victory implies less stimulus money, lower expected future inflation, and a reduced likelihood of a tax increase.

Brown’s victory reduced the likelihood of a tax increase which can explain much of today’s rally. The first two implications are related since a decrease in our current level of deficit spending will in turn decrease expected future inflation. However, lack of necessary stimulus could result in a serious problem. For the record, I disagree with deficit spending, particularly when the intent is to influence the business cycle. With this in mind, reducing or eliminating the current stimulus policy will cause us to fall into a Depression. The government cannot stop stimulating this economy without certainty that we are recovering. Notice I said CERTAINTY and RECOVERING.

Intel Corp. (INTC) and J.P. Morgan Chase & Co. (JPM) Follow-Up

Both Intel Corp. (INTC) and J.P. Morgan Chase & Co. (JPM) beat analyst estimates as well as Whisper Number expectations last week[1]. Both companies also traded lower on Friday with heavy volume[2]. This negative response to “positive” news suggests negative sentiment among traders, both professional and retail, and is in line with my expectation and forecast that this earnings season will bring the markets closer to reality.

Citigroup Inc. (C) and IBM (IBM) report Tuesday. Worse than expected results will provide more ammunition for the bears and potentially the first 2 day loss for the indices since early December [3].

[1] INTC $0.30 Analyst Estimate vs. $0.33 Whisper Number Expectation vs. $0.40 Actual
JPM $0.62 Analyst Estimate vs. $0.66 Whisper Number Expectation vs. $0.74 Actual
[2] INTC traded on 1.31 times previous day’s volume, JPM traded on 1.84 times previous day’s volume
[3] December 7 and December 8

Intel Corp. (INTC)

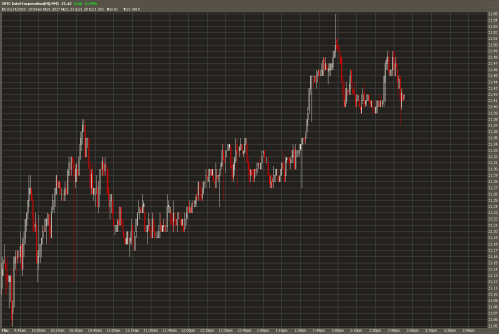
Intel Corp. (INTC) will report after market close today. Intraday INTC is up about 2%[1]. Analyst estimate $0.31 EPS compared to a slightly higher Whisper Number[2]. If earnings are in-line with analyst estimates, I expect to see a decent sell-off. A broad market sell-off will follow tomorrow if comfort cannot be found in J.P. Morgan Chase & Co. (JPM) earnings results.

INTC Intraday

INTC Last 6 month

[1] +$0.45 (2.13%) to $21.42 at 2:26 EST
[2] Whisper Number can be found at http://www.whispernumber.com

What January Effect?

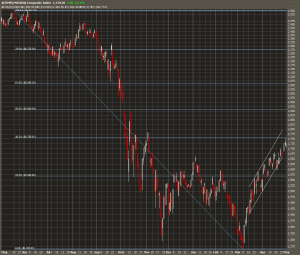
The markets experienced a modest 6 day rally[1] to begin 2010 in what many are calling a continuation of the current up trend. Although the markets have rallied nicely from the November lows and finally broke out above December’s resistance levels, this rally is lacking significant substance. Market Fallacy has been bearish for some time now. While not all data has conclusively supported this rally, the important indicators continue to suggest a future decline. Sadly, the brilliant talking heads on CNBC are calling for a “bigger event” to act as a catalyst for this market. Unemployment (although a lagging indicator) has been 10% for two consecutive months[2], today’s retail sales numbers[3] were much worse than expected and Alcoa severely missed analyst expectations[4]. If this any indication on how earnings season might go: here is the BIGGER EVENT.

SPX Last 9 Months

[1] Approximately 2.86%
[2] November Consensus 10.2% vs. Actual 10.0%, December Consensus 10.1% vs. Actual 10.0%
[3]  Consensus 0.4% vs. Actual -0.3%
[4]  Analysts Estimate 0.6 vs. Whisper Number 0.07 vs. Actual Earnings of 0.01

Market Fallacy 2.0

Market Fallacy is back with a new and improved format. Sign up for the Market Fallacy Newsletter at http://www.marketfallacy.com to receive insight into our proprietary approach. Stay tuned in to our blog to receive full market commentary. Market Fallacy will no longer give explicit buy/sell recommendations, but will instead provide a framework for understanding our proprietary analytics.

Look for a follow-up to the Summer Stock Picks, Earnings Season Coverage and Market Analysis

Proof but no Pudding

Futures rally on better than expected Q3 GDP (3.5% vs. 3.2% median estimate). Is this enough to stop the current retracement? There will be an early morning pop, and the markets won’t take long to reveal which way they are headed. If the early morning gains are not sustained, SPX will retest 1000. Yesterday, NASDAQ closed below 50 day moving average on 120% of 10 day average volume.

Profit Taking?

Market Fallacy apologizes for any inconvenience that resulted from the switch to the new format. The Market Fallacy Blog, www.marketfallacy.wordpress.com, will now provide macroeconomic analysis, while the newsletter will give stock picks and recommendations. For the remainder of May the recommendations will be free of charge, but starting June 1, 2009, there will be a monthly charge to view the updated predictions. Each newsletter will be broken down into two types of recommendations: Preferred Picks and Optional Picks. Preferred Picks are must haves for any portfolio, whereas Optional Picks give the reader the opportunity to choose between two companies in a particular sector or industry. For Optional Picks, the recommended allocation is to divide the capital between the companies instead of holding full positions in both. This strategy is suggested since Optional Picks will typically be in the same sector or industry. When allocating do not over expose your portfolio to the given sector by allocating too much in each of the Optional Picks.
 
Preferred Picks
The three Preferred Picks for this newsletter are Goldman Sachs (GS), Ford Motor (F), Proshares Double Crude (DXO).
As of the close on Friday, Goldman Sachs is approximately 10% above its recent equity offering price. Based on academic studies in behavioral finance, on average, companies that issue seasoned equity offerings have approximately 40% cumulative abnormal return in the 500 days leading up to the announcement. On average, the price of the equity drops to reflect the new offering price, and then remains flat for about 3 months. The fact that GS has already been able to overcome the typical scenario has positive implications on Goldman’s future. Market Fallacy recommends buying Goldman Sachs (GS) up to $155. At the current price, this will be an approximate 15% return, in addition to the $1.40 per year dividend.
 
Ford Motor also just recently raised capital through an equity offering. Although the stocks has not returned to pre-issuance levels, Market Fallacy recommends buying Ford Motor (F) up to $8. At the current price, this will be an approximate 46% return.

 
Proshares Double Crude (DXO) is an etf that tracks twice the daily return of light sweet crude oil (WTI). Market Fallacy has had a buy rating on DXO since $2.80, and reaffirms this recommendation up to $6. At the current price, this will be an approximate 84% return.
For more information on Market Fallacy’s oil outlook, please visit www.marketfallacy.wordpress.com
 
Optional Picks
The first Optional Pick is in the basic materials sector and agricultural chemicals industry. Potash Corporation of Saskatchewan (POT) and Mosaic Company (MOS) are the two choices for the first Optional Pick.

Potash (POT)

Potash (POT)


Mosaic (MOS)

Mosaic (MOS)


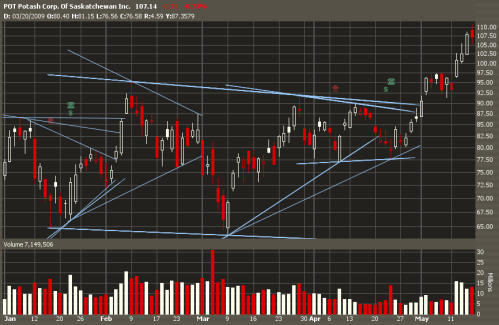
Based on technical analysis, the triangle bullish pattern breakout implies POT is headed higher. POT has recently established support on top of prior resistance, also bullish. Market Fallacy recommends building positions in POT on pull backs only, as the current price has broken out above previous consolidation levels. Market Fallacy’s price target for POT is $130. At the current price, this will be an approximate 22% return, in addition to the $0.40 per year dividend. On Thursday, MOS had a bullish engulfing candlestick which was confirmed on Friday. This candlestick pattern in addition to the current breakout above the bullish channel suggest further appreciation in the stock price. Market Fallacy recommends buying MOS up to $63. At the current price, this will be an approximate 23% return, in addition to the $0.20 per year dividend.
 
The second Optional Pick is in the technology sector. Research in Motion (RIMM) and Apple (AAPL) are the two choices for the second Optional Pick.

Research in Motion (RIMM)

Research in Motion (RIMM)


Apple (AAPL)

Apple (AAPL)

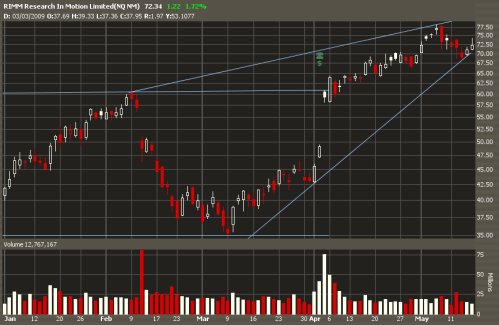
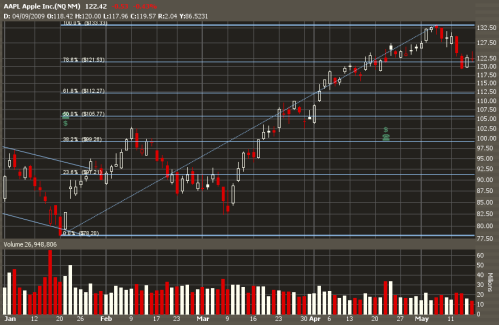
Based on technical analysis, the rising wedge patter suggests RIMM is setting up to break out. After the recent pull back in techs, it is likely there will not be a better entry point the rest of the summer. Market Fallacy recommends buying RIMM up to $95. At the current price, this will be an approximate 31% return. Fibonacci retracements and Elliot Wave Theory explain the recent pull back in AAPL as a corrective wave. Wave 4 down precedes impulse wave 5 up, which in theory will be between 20-50%. Market Fallacy recommends buying AAPL up to $155. At the current price, this will be an approximate 27% return.
 
Market Outlook
After the recent 5% retracement, the market approaches an important point where it must decide to break the short term up trend or rejoin the longer term down trend. Given the recent economic data which suggests the economy is improving, Market Fallacy reaffirms its long positions. Any new optimism will spark additional fuel for this rally. In the coming days expect above average volume, volatility and price movement.

Welcome Back!

I apologize to those consistently checking for new posts, and I thank you for your dedication. As the school year came to an end, I didn’t feel comfortable posting without giving my undivided attention to the current events in the market. The markets are dynamic and require constant interpretation.

Having said this, I’d like to reiterate my positions and price targets. I am still bullish on the financial sector, as well as the overall market. I can see both the DJIA and the SPX testing 10,000 and 1000 respectively before any significant resistance and/or retracement. During last week’s move higher, the trading volume spiked above the 10 day average, about 5B. This week is setting up for a huge move, many will suggest lower, but I believe we could see the mother of all short squeezes. As of the end of March, there was approximately $3.9 trillion in money-market fund assets and about $3.4 trillion in equity mutual fund assets. This unusual proportion implies that the current rally could pick up steam, and fast. From August 2008 to March 2009, there has only been one month where equity assets have increased, December. Although February to March did increase, April’s numbers will be more telling. Money-Market assets have consistently increased from September 2008 to January 2009, remaining essentially constant from January to March. May of 2008 boasted excess of $6 trillion in equity assets suggesting the current position could almost double. The price impact of this large of a monetary influx would be tremendous. Yesterday’s decline was short lived, and it should be noted that tech did not decline as much as the rest of the market.

After the market closes I will continue the post.

Passing The Stress Test

DJIA

DJIA

SPX

SPX

Nasdaq Composite

Nasdaq Composite

XLF

XLF

 The real stress test has already happened, but these results won’t be publicly recognized. For the last few weeks, the major indices have tested upside resistance multiple times tempting the bears to get back into the game. The remaining uncertainty in the market is significantly less than at the beginning of the year, and the Government’s Stress Test and auto industry turmoil account for a large percentage of the overall market volatility. The results of the Stress Test have been delayed three days, to May 7th. The delay stems from disagreement between the banks and the regulators, and while only delaying the inevitable, is perceived as a positive. There is only one reason the banks would disagree with regulators over the results, because the regulators made a mistake, miscalculated or estimated incorrectly. If the regulators were to overestimate, the banks would never raise attention to it. The disagreement has positive market implications, particularly because most, if not all, negative news has been priced in. This week’s volume was below average, but this is to be expected. Smart money is either already long, or they are awaiting the results of the Stress Test so they can jump into the “healthy” banks. The bears had plenty of opportunities to take this market lower, but failed to succeed, even in the light of a worse than expected GDP.

The first chart is the Dow Jones Industrial Average over the last 20 years, monthly. The Fibonacci retracements suggest important resistance at 8240. Closing above 8240 resistance at the end of May would imply the market has its sights set on the next level, 9650. At the end of May, when the markets have closed above the 8240 level, the uptrend march will  continue. I can see the DJIA testing 10,000 during the summer, but do not expect this to last. Expect the DJIA to retrace all the way back to the 8240 level after touching 10,000. This retracement would be extremely healthy, and would establish a base, or support, on top of current resistance. Establishing support on top of previous resistance has bullish implications, and is exactly what each of the major indices is currently doing.

The second chart is of the S&P 500 over the last 10 years, monthly. The Fibonacci retracements again suggest we are approaching important resistance levels, 880. Closing above 880 for May implies 1014 is next. Again, after touching this level, I expect a retracement to 880. The third chart is of the Nasdaq Composite over the last year, daily. No surprises here, the Nasdaq is also nearing important resistance at 1760. Closing above 1760 for the end of a day would imply 1900. However, I expect the Nasdaq to fill the gap at 1950 before retracing. Depending on the relative strength of the market at this time, I do not necessarily expect the Nasdaq to retrace as significantly as the DJIA or SPX. The fourth chart is the XLF Financial SPDR over the last year, daily. Fibonacci retracements are deliberately not drawn here. Over the last month, the XLF has gapped higher and begun to consolidate. This consolidation is similar to what the indices are doing, except the XLF’s next move is contingent on the results of the Stress Test.

As I mentioned already, these results will eliminate a lot of the uncertainty surrounding the financial sector, and will likely be the necessary catalyst to lift this market higher. It is not a coincidence that the markets appear to be searching for a catalyst, especially since reasons for the market to trade lower have not caused any significant decline. Much of the negative news regarding the banks and any forced capital increases has already been priced in. Citigroup and Bank of America, 2 of the 19 banks preparing to receive results of the Stress Test next week, have been shorted heavily. Rumors turned fact concerning additional capital has hit both Citigroup and Bank of America hard, but most analyst do not expect significantly negative remarks from the Government. Citigroup has already announced the conversion of preferred shares to common at the conversion price of $3.25. The short interest in Citigroup is about 23%, and any relatively good news will cause a huge squeeze. I expect to see Citigroup double before expiration of the June option contracts. The open interest for the June $5 calls is over 1.7 million. The derivative markets are quiet indicators of what’s to come.

Markets do not like uncertainty, and when the banking and auto industry issues have been resolved, expect a continuation of this bull market rally. The three largest contributors to the recent market decline was housing, banking and the auto industry. The housing issues were resolved some time ago when the Government took control of Freddie Mac and Fannie Mae. However, it took until a few weeks ago to empirically support a housing bottom. The recovery of the banking crisis began with the failure of Bear Stearns, showed signs of improvement with the consolidations of Merrill Lynch into Bank of America and Wachovia into Wells Fargo, government intervention with AIG, and the collapse of Lehman Brothers. Thursday’s Stress Test results will conclude the banking industry’s roller coaster ride, and mark the beginning of the financial recovery. The finalization of  the Chrysler/Fiat deal and the restructuring of General Motors will consummate this entire financial crisis. Although it is clear that the auto industry was not initially involved in this crisis, the threat of systemic risk implied by the collapse of the industry exacerbated fear and volatility in the markets. As each of these issues are put further and further in the past, less overall market uncertainty and volatility will exist. This directly implies steady growth, in my opinion, similar to the growth seen in the 90’s. Low volatility and steady growth are characteristic of secular bull markets.

Building a New Foundation

SPX

SPX

The SPX has broken out above the 877 Fibonacci retracement level. This is extremely bullish, and from a technical standpoint suggests the SPX is headed to 934. Closing above 877 is important and will confirm the suspected rally. I expect to see the DJIA test 9000 and the SPX to test 950 over the next couple of weeks. If the markets create support at the current levels, enough consolidation will have occurred to support a substantial rally in the near future. The talking heads on CNBC are finally catching on and have suggested the possibility of DOW 10k by the end of the summer. Please review my archived newsletter http://marketfallacy.com/newsletter/files/Market_Fallacy_%7C_4-7-09_%7C_Cautiously_Optimistic_2009-04-07.html, to see that I have been suggesting this possibility since April 7th, when the DJIA closed at 7790.

Here is one of the articles on CNBC’s website suggesting DOW 10k. http://www.cnbc.com/id/30478135 However, my reference is to the anchors on CNBC’s television show.